What is Gitlytics? The Complete GitHub Traffic & Profile Suite
A comprehensive guide to Gitlytics - persistent repository traffic analytics beyond the 14-day limit, interactive CLI diagnostics, automated GitHub Actions, customizable README badges, and AI-powered repository health insights.
When you build open-source software, release a new library, or share developer resources on GitHub, understanding how developers find and interact with your code is crucial. Unfortunately, GitHub provides a rolling window of only 14 days of traffic data before it is permanently deleted.
This is where gitlytics comes in.
gitlytics is an open-source GitHub analytics and customization platform. It bridges the gap between raw metadata and long-term repository intelligence, providing persistent tracking, interactive charts, README badges, tech logos, and developer profile cards.
In this post, we’ll explore every feature gitlytics ships, how they work, and how you can use them to elevate your repositories and developer profile.
---
1. Defeating the 14-Day Limit: Permanent Traffic Retention
At its core, gitlytics acts as a data engine for your repository traffic. Every day, GitHub silently discards:
* Daily views and unique visitors
* Daily clones and unique cloners
* Top referrer sources (where your traffic is coming from)
* Popular content paths (which files and folders are viewed most)
gitlytics offers three distinct, interoperable interfaces to save and retrieve this data indefinitely:
The CLI & Python Library
Installable via PyPI, the
gitlytics Python package offers full command-line capabilities to fetch live traffic and sync snapshots into monthly or yearly CSV files:pip install "gitlytics[dashboard]"
gitlytics sync --token YOUR_GITHUB_TOKEN --data-dir ./my-traffic
The engine deduplicates overlaps by merging today's new data with existing records, ensuring a clean history without duplicate rows.
The GitHub Action Companion
If you prefer not to manage local cron jobs, you can use the
gitlytics-action workflow. Running automatically on a schedule (every 13 days, inside GitHub's safety buffer), it pulls traffic metrics and commits the CSV files directly back to a specified branch in your repository. Your data is versioned, diffable, and completely owned by you.The Cloud Dashboard
For a zero-maintenance setup, the hosted platform at [dashboard.gitlytics.dev](https://dashboard.gitlytics.dev) runs background synchronization nightly. You log in via GitHub OAuth, pin up to 3 repositories per workspace, and let the dashboard build and store your history.
The Action automatically organizes and appends daily snapshots into monthly CSV archives within your repository structure:
.
├── .github/workflows/traffic-sync.yml
└── data/
    ├── traffic_2026-06.csv
    ├── traffic_2026-07.csv
    └── stargazers.csv
---
2. Four Core CLI Commands
Gitlytics is powered by four main CLI command structures:
gitlytics fetch
Fetches your live 14-day traffic and outputs a beautiful ASCII table directly in your console. This is ideal for quick terminal diagnostics:
gitlytics fetch --token YOUR_TOKEN --print-table --metrics views clones
gitlytics sync
Fetches traffic and appends it to your persistent CSV files. You can schedule it natively inside the terminal as a background daemon:
gitlytics sync --token YOUR_TOKEN --data-dir ./data --schedule-cron "0 23 *"
gitlytics stars
Retrieves cumulative stargazer counts over time, generating a complete growth trajectory and history of your project.
gitlytics stars owner/repo --token YOUR_TOKEN
gitlytics dashboard
Spawns the local web server hosting the React-based visual dashboard. It also supports a headless "TV Mode" for continuous office monitor displays:
gitlytics dashboard --token YOUR_TOKEN --data-dir ./data
---
3. Interactive Dashboards (Self-Hosted & Cloud)
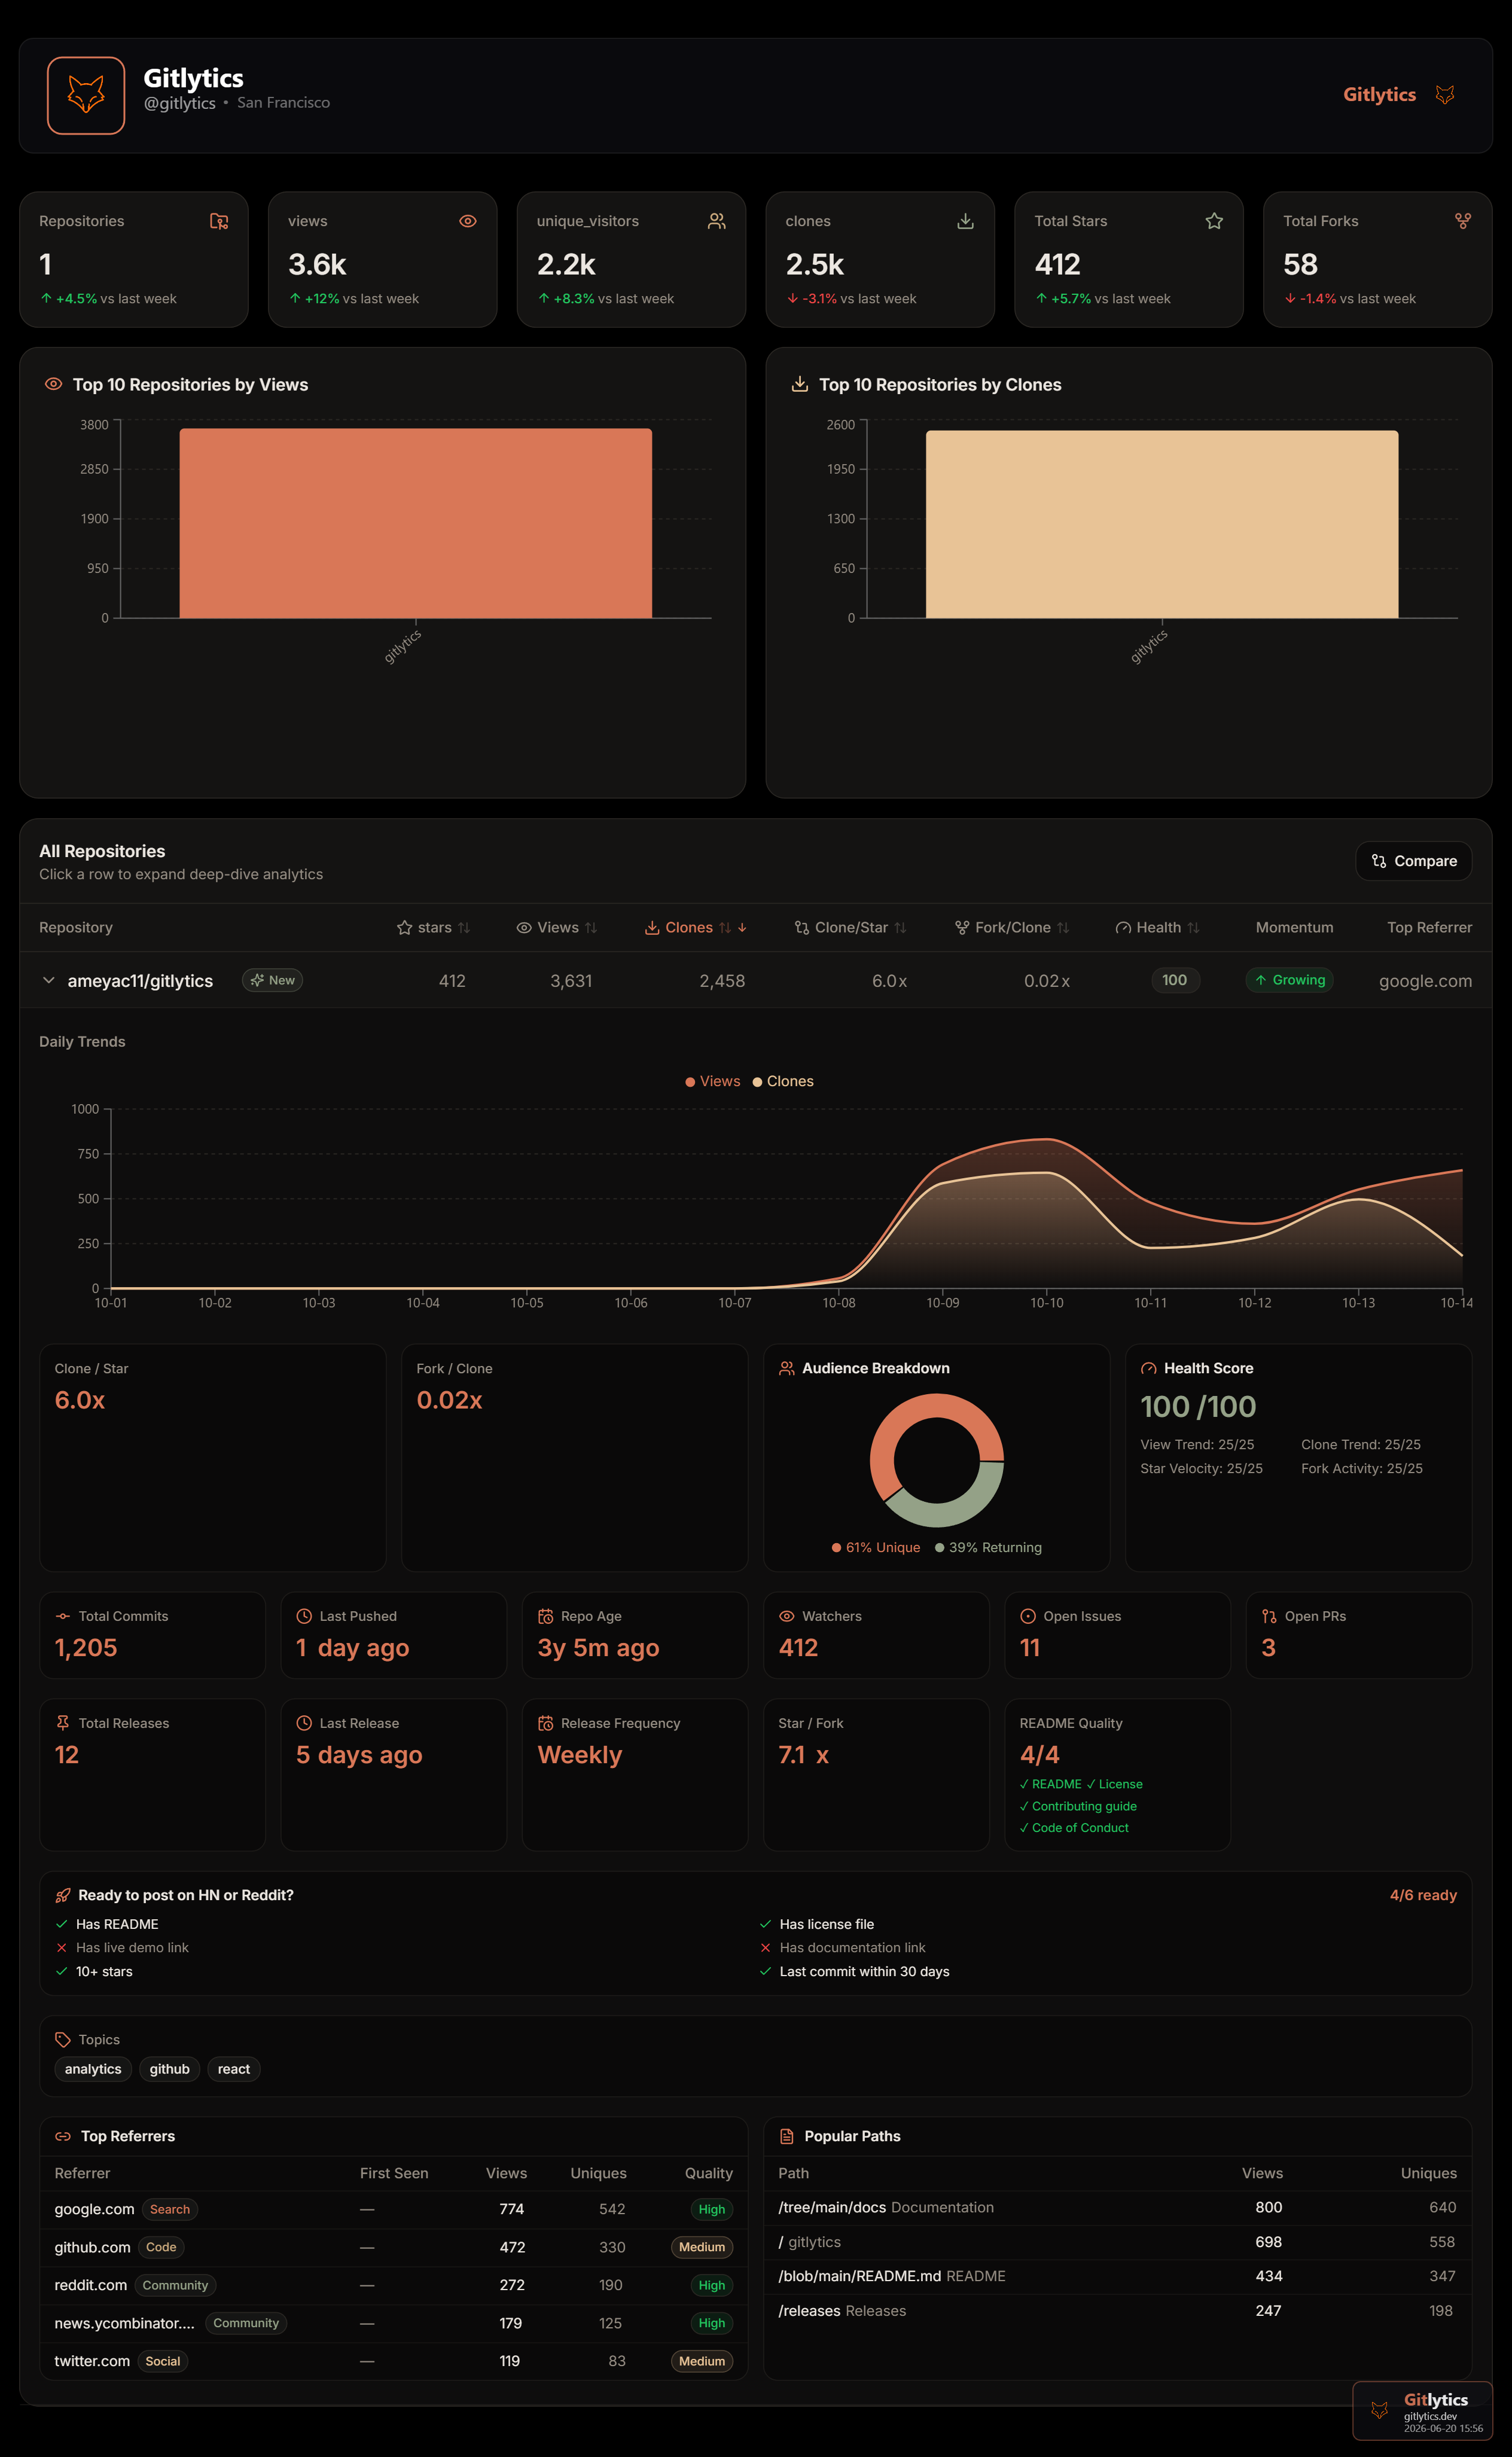
Once your traffic history is safely captured in CSV databases, gitlytics turns it into interactive charts. Whether you run the React web UI locally or use the cloud dashboard, you get:
* Traffic Trends: Interactive line and bar charts tracking views, unique visitors, clones, and cloners across days, months, or years.
* Stargazer Timelines: Historical cumulative star growth trajectories mapping out repository traction milestones over time.
* Referral Breakdown: Analysis of the top sites directing developers to your repository, with rolling visitor counts.
* Popular Content Paths: Insight into which directories, readmes, or code files are attracting the most attention.
---
4. Dynamic Profile Widgets & Badges
Beyond data storage and charts, gitlytics serves as a widget delivery engine for your GitHub READMEs and portfolios. It features a native SVG rendering suite that generates real-time, custom-styled cards:
Repository Customizer Badges
You can generate real-time metrics badges or mini-charts to embed directly in your Markdown readmes:
* Metric Badges: Clean badge capsules indicating current views, clones, or stars.
* Chart Badges: Dynamic mini inline graphs visualizing traffic trends (views or clones) over the last 14 days directly inside your repository readme files.
Developer Profile Cards
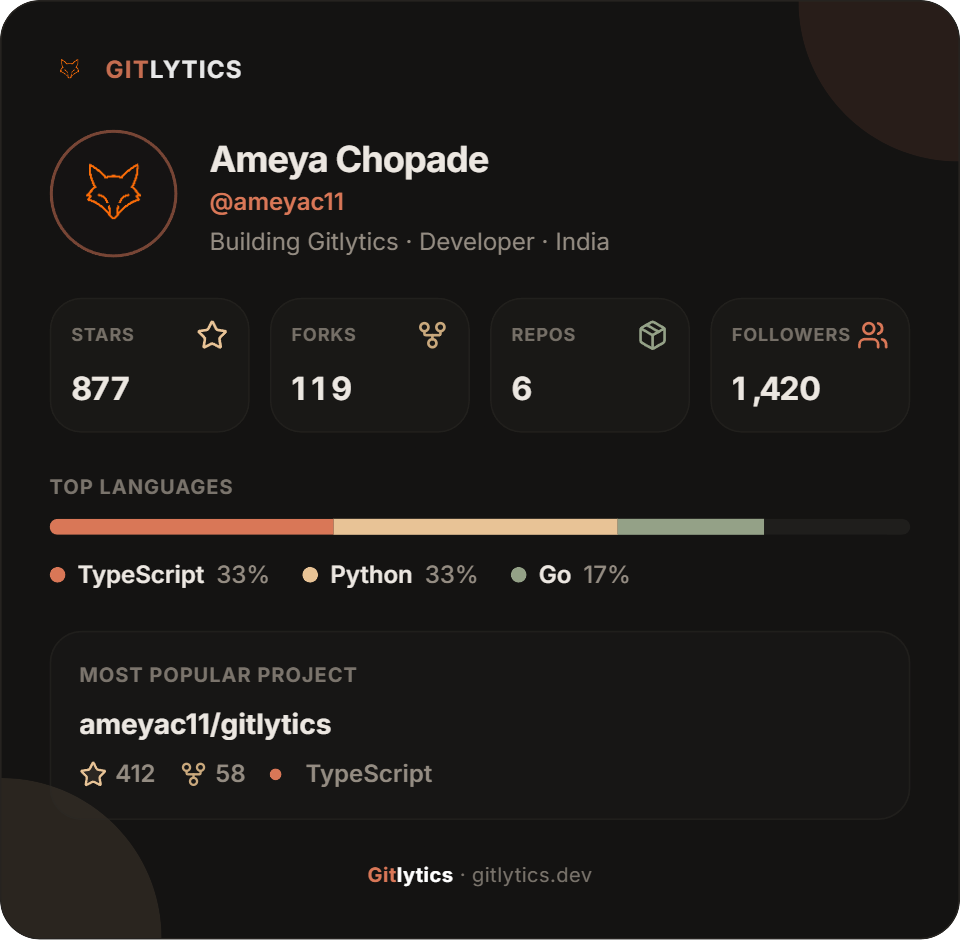
Visual cards presenting your developer profile statistics, styled in over 30 themes (such as Tokyo Night, Nord, Dracula, Radical, and Solarized Dark):
* Profile Details & General Stats: Showcases global follower stats, public repos, and total stars.
* Languages & Technologies: Renders visual bar charts detailing repository-level language distributions and code sizes.
* Activity & Streaks: Highlights your weekly/monthly contribution velocity and active daily streaks.
* Milestones & Star Journeys: Renders progress trackers and milestones of repository star growth.
Tech Stack Capsule Badges
* 200+ Tech Stack Logos: Flat, color-coded capsule badges featuring official icons for frameworks, tools, databases, and services (such as Python, TypeScript, React, Docker, and AWS).
* Text-Only Concept Badges: Renders styled badges for theoretical concepts that lack official brand logos (e.g. SRE, RAG, Vector Search, Agentic AI, and Fine-Tuning).


Here is an example of the interactive developer profile customizer:
---
5. Workflow Integrations (Email & Beyond)
To help keep you informed without requiring you to constantly check the dashboard, gitlytics supports workflow integrations that deliver updates directly to where your team works:
* Email Digests & Alerts: Receive verified weekly traffic summaries and real-time email alerts when repository views or clones spike. Settings are fully customizable from the dashboard workspace.
* Ecosystem Integrations (Coming Soon): Active development is underway to support channel notifications and workflows for Slack, Discord, Microsoft Teams, Webhooks, Vercel, Netlify, Jira, Linear, Notion, Figma, and Datadog.
---
6. Deep Repository AI Analysis
Sometimes, numeric traffic spikes don't tell the whole story. To help you understand the engineering activities behind the traffic, gitlytics includes a Deep Repository Analysis feature:
* Health Scores & Activity Metrics: Evaluates contributor concentrations, commit cadences, and open issue volumes.
* Hotspot Finder: Pinpoints frequently changed files or directories to highlight active areas of codebase churn.
* CI/CD & PR Checks: Aggregates pull request lifecycles and build health statuses into a single review section.
* 24h Context Caching: Caches AI-generated reports for 24 hours to keep page loads fast while offering a stable, point-in-time review of your codebase health.
---
The Takeaway
GitHub traffic insights don't have to be temporary, and your developer profile doesn't have to be static. By providing CLI tools, automated workflows, hosted dashboards, customizable SVG badges, and AI-driven repository reviews, gitlytics builds a complete platform to capture, explore, and present your software development lifecycle.
Ready to get started? Register your workspace on [dashboard.gitlytics.dev](https://dashboard.gitlytics.dev), or install the core CLI directly on your terminal:
pip install gitlytics